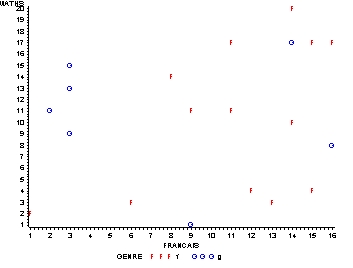
symbol1 v=f" color=red interpol=none; symbol2 v=g" color=blue i=n; proc gplot data=donnees; plot maths*francais= genre; run;