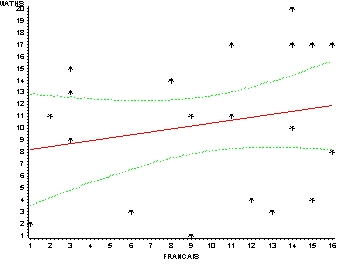
symbol1 i=rlclm90 cv=black ci=red co=green v=star; proc gplot data=donnees; plot maths*francais; run;