Data annote (keep =X Y XSYS YSYS TEXT POSITION);
set donnees END=fin;
if fin then do;
XSYS='2';YSYS='2';
POSITION='7';
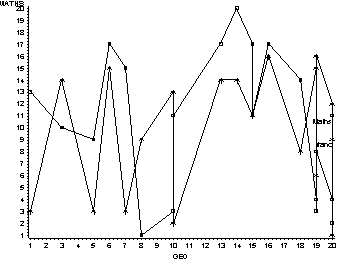
X= geo ;
Y=maths ; TEXT='Maths'; OUTPUT;
y=francais; TEXT='francais';OUTPUT;
end; run;
symbol1 v=square i=join;
symbol2 v=star i=j;
proc gplot data=donnees;
plot (maths francais)*geo / overlay annotate=annote;
run;