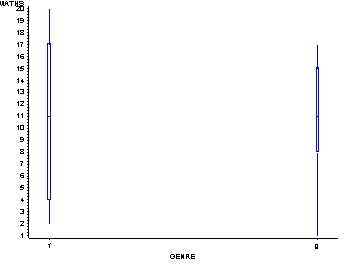
symbol1 i=box co=blue ; axis1 offset=(5,5) minor=none ;
proc gplot data=donnees; plot maths*genre /haxis=axis1 ; run;