proc princomp data=donnees out=individu
;
var maths francais geo histoire ;
run;
proc factor data=donnees outstat=stat
mineigen=1 /* application
du "critère de Kaiser" */ ;
var maths francais geo histoire ;
run;
proc transpose data=stat out=corr ;
where _TYPE_="PATTERN";
run;
data annote1 ; set corr; x=FACTOR1;
y=FACTOR2;
xsys='2'; ysys='2'; text= _NAME_; size=1.5;
run;
data cercle; do i = 1 to 100;
x=cos(arcos(-1)*i/10); z=sin(arcos(-1)*i/10);
output; end;
run;
data correl; set annote1 cercle;
run;
symbol1 i=none v=point ; symbol2 i=spline c=green v=none;
proc gplot data=correl;
plot y*x=1 z*x=2 /overlay annotate=annote1 href=0 vref=0;
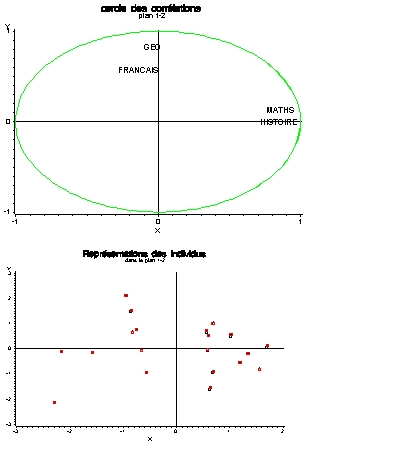
title1 "cercle des corrélations"; title2 "plan
1-2;
run;
data annote2; set individu ; x=prin1; y=prin2; xsys='2';
ysys='2'; size=1; text=genre ;
run;
symbol1 v=square c=red;
proc gplot data=annote2; plot y*x / annotate=annote2
href=0 vref=0;
title1 " Représentations des individus";
title2 " dans le plan 1-2";
run;